


:quality(85):upscale()/2024/05/16/972/n/3019466/bdef1173664686cb9f4ef6.25594233_.jpg)
As Ripple v. SEC Trial Rages on, the XRP Price Continues Crashing: How Low Can it Go?
After experiencing a significant plummet, Ripple broke below its multi-month ascending trendline and retraced toward the breached level, completing a pullback. This price action suggests a bearish sentiment in the market, potentially leading to a continuation of the downward retracement. XRP Analysis By Shayan The Daily Chart Upon thoroughly examining the daily chart, it’s apparent […]
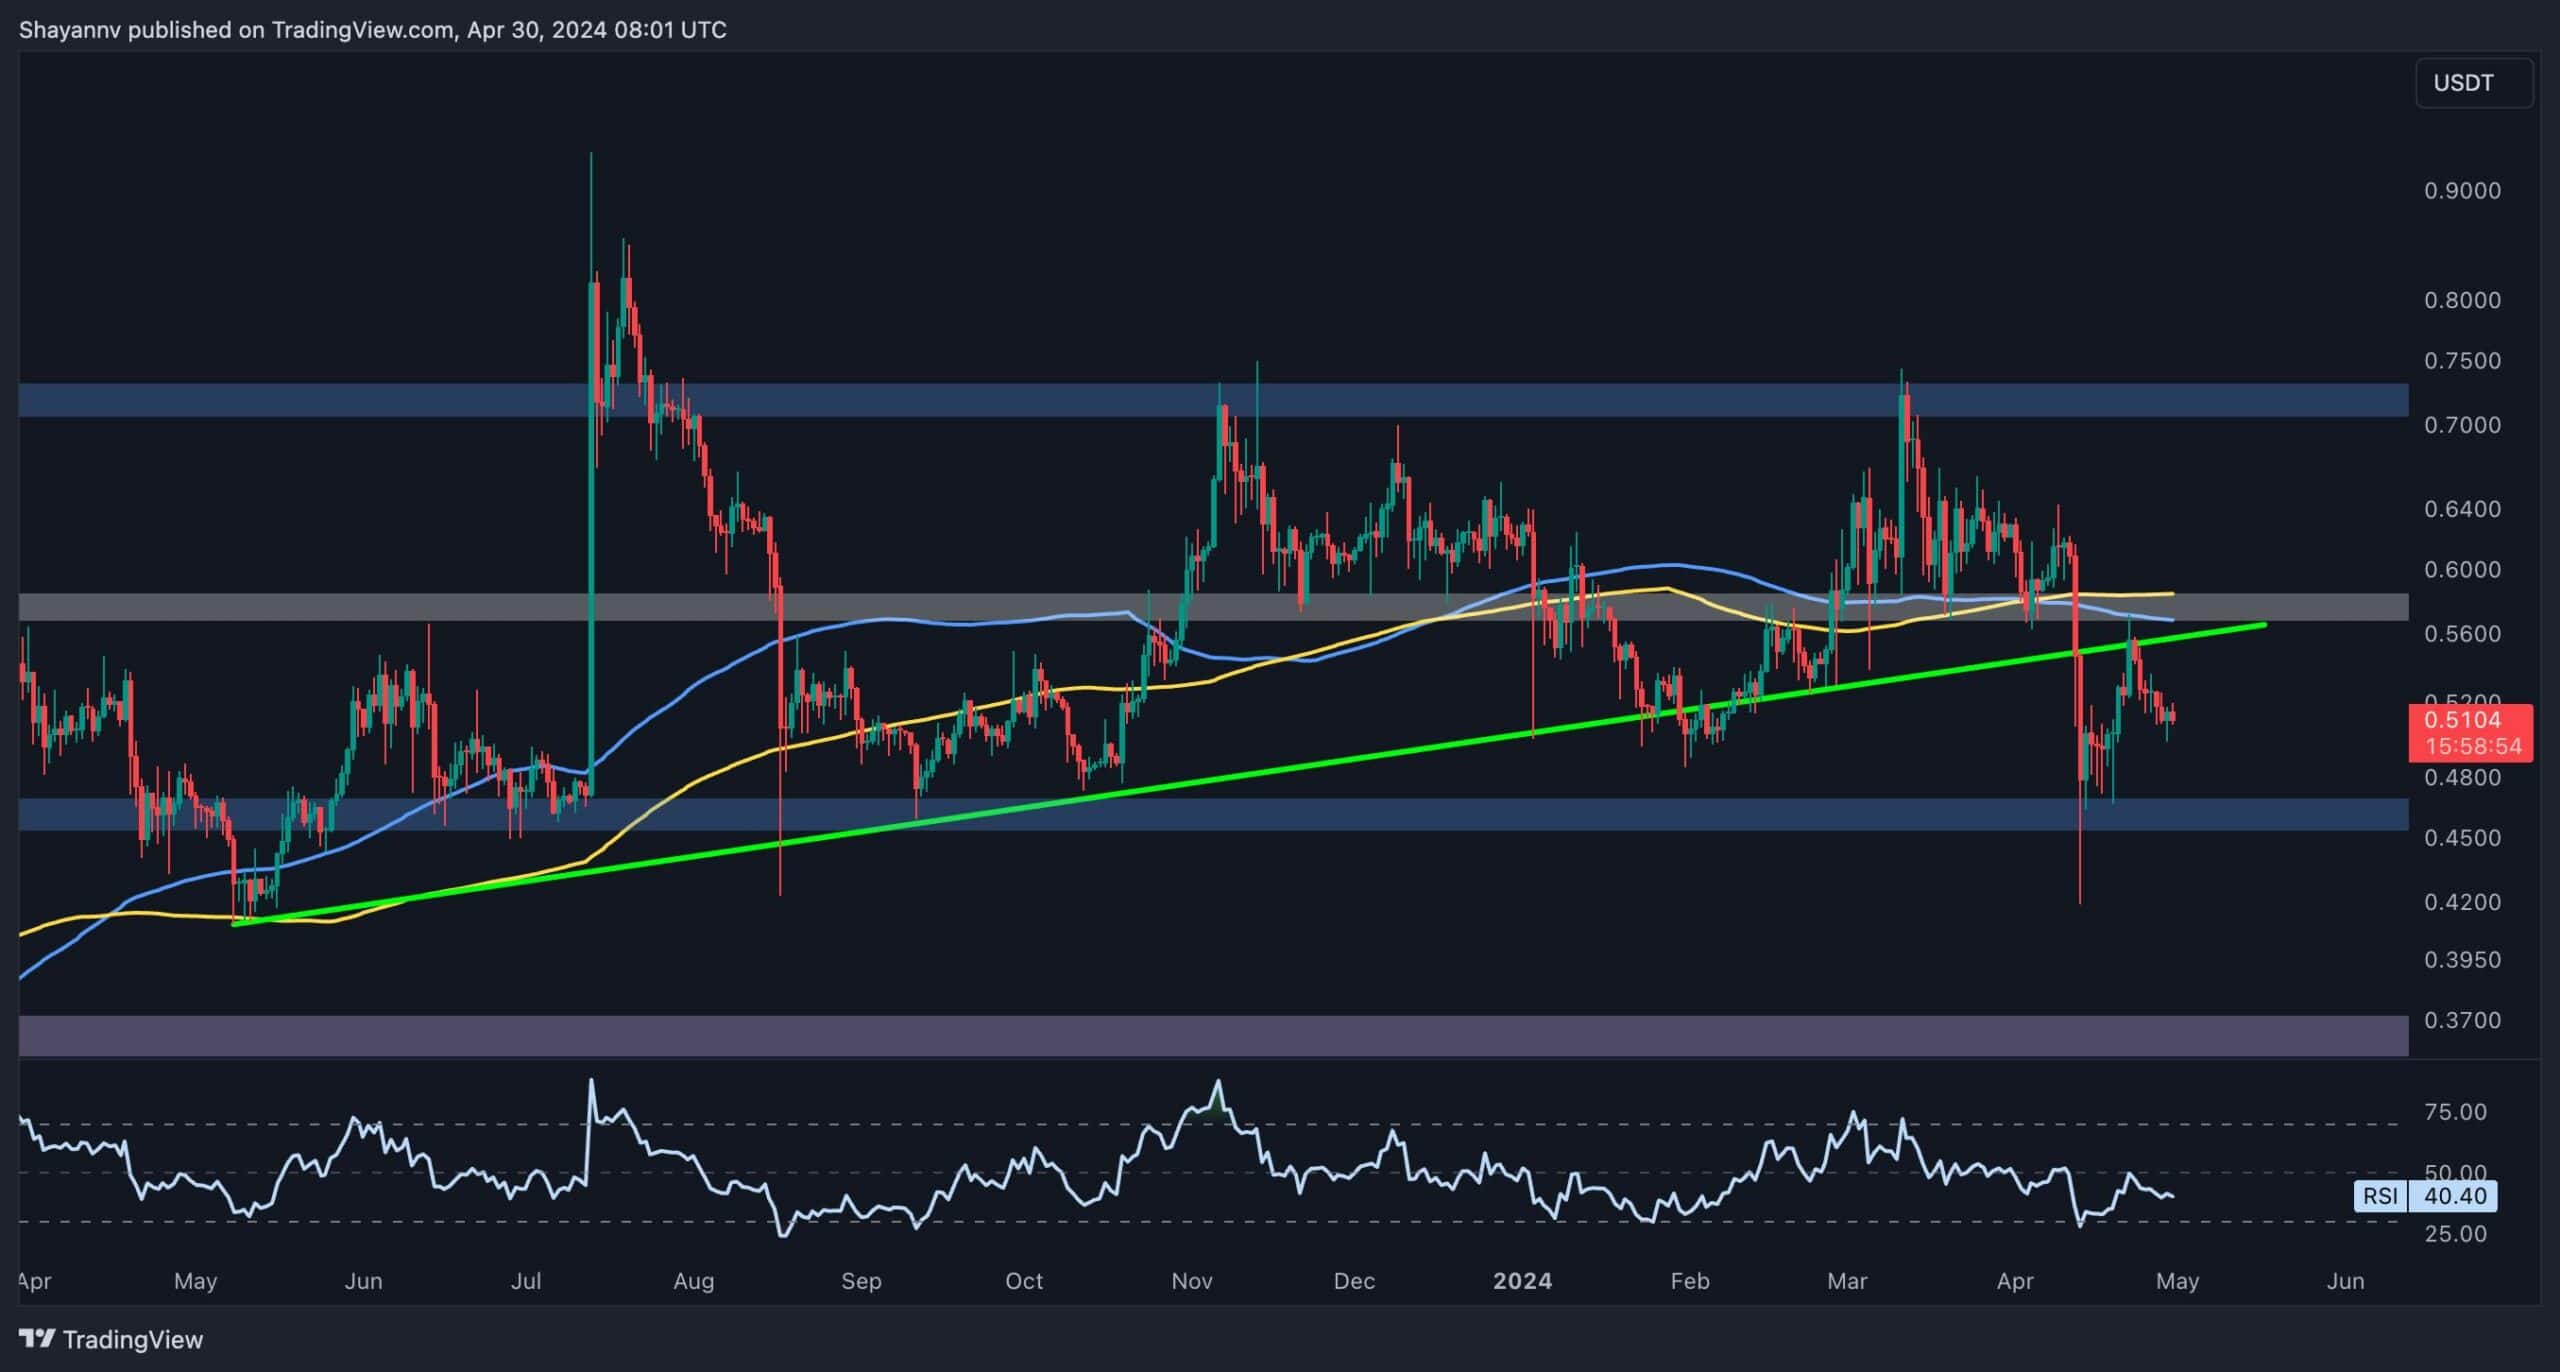
After experiencing a significant plummet, Ripple broke below its multi-month ascending trendline and retraced toward the breached level, completing a pullback.
This price action suggests a bearish sentiment in the market, potentially leading to a continuation of the downward retracement.
XRP Analysis
By Shayan
The Daily Chart
Upon thoroughly examining the daily chart, it’s apparent that XRP underwent a substantial decline below the multi-month ascending trendline, subsequently moving toward the $0.45 threshold. However, buyers stepped in, initiating a bullish rebound towards the previously breached ascending trendline at $0.56 and the 100 and 200-day MAs around $0.59, thereby completing a pullback.
Despite this temporary rebound, the price action indicates a bearish sentiment in the market, with Ripple potentially poised for a sustained retracement toward the critical support region of $0.45. Consequently, XRP looks likely to remain within the price range delineated by the $0.45 support level and the resistance zone of $0.59 long-term until a breakout occurs.

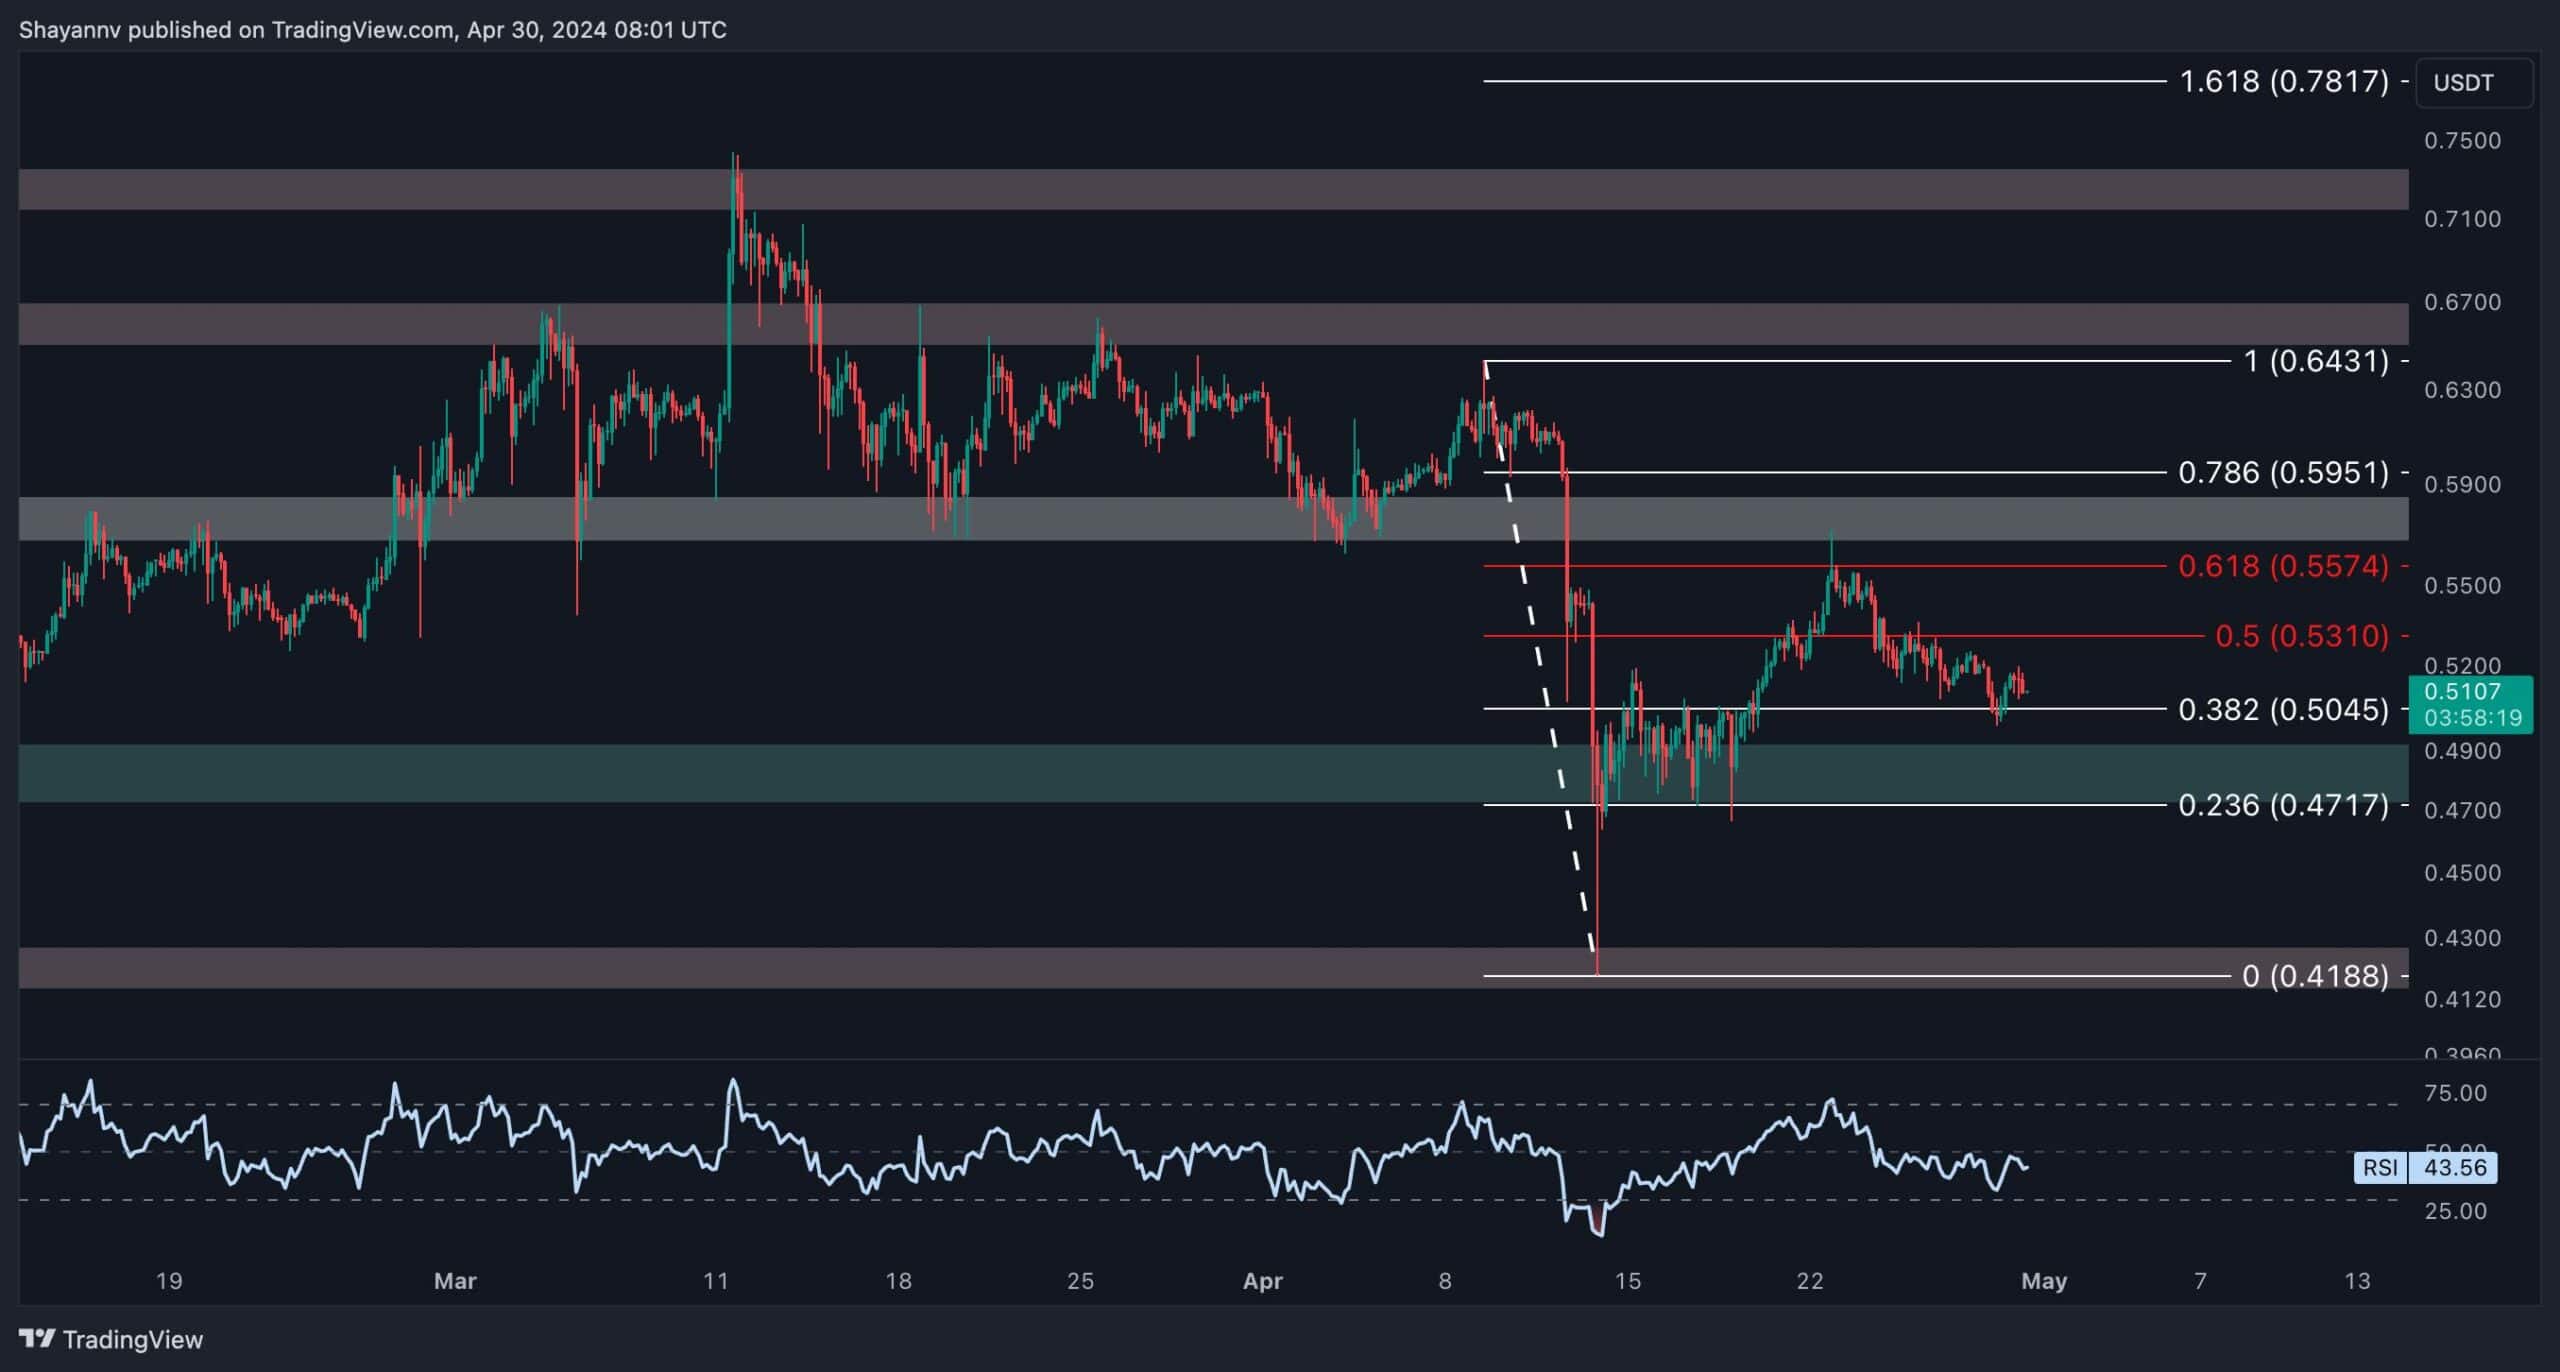
The 4-Hour Chart
A closer inspection of the 4-hour chart reveals that Ripple stabilized around the $0.49 mark following a notable decline, subsequently experiencing a bullish retracement towards a significant resistance region outlined by the price range between the 0.5 ($0.5310) and 0.618 ($0.5574) Fibonacci levels.
However, the price encountered heightened selling pressure near this critical juncture, continuing the initial bearish trend.
Currently, XRP sellers aim to breach the crucial $0.49 threshold, potentially triggering a notable long-squeeze event. Nevertheless, a more plausible scenario is that the price remains within the range defined by the support of $0.49 and the resistance of the 0.5 ($0.5310) and 0.618 ($0.5574) Fibonacci levels, indicating the likelihood of the market continuing its current state of consolidation.
The post As Ripple v. SEC Trial Rages on, the XRP Price Continues Crashing: How Low Can it Go? appeared first on CryptoPotato.