


:quality(85):upscale()/2024/05/16/972/n/3019466/bdef1173664686cb9f4ef6.25594233_.jpg)
Is ETH About to Plummet Below $3K or Will the Bulls Step In? (Ethereum Price Analysis)
Following a period of consolidation near critical support marks defined by the 0.5 and 0.618 Fibonacci retracement levels, alongside the 100-day MA, Ethereum witnessed a modest bullish rebound. However, it still contends with a notable resistance range, the breach of which holds potential for a renewed bullish momentum. Technical Analysis By Shayan The Daily Chart […]
Following a period of consolidation near critical support marks defined by the 0.5 and 0.618 Fibonacci retracement levels, alongside the 100-day MA, Ethereum witnessed a modest bullish rebound.
However, it still contends with a notable resistance range, the breach of which holds potential for a renewed bullish momentum.
Technical Analysis
By Shayan
The Daily Chart
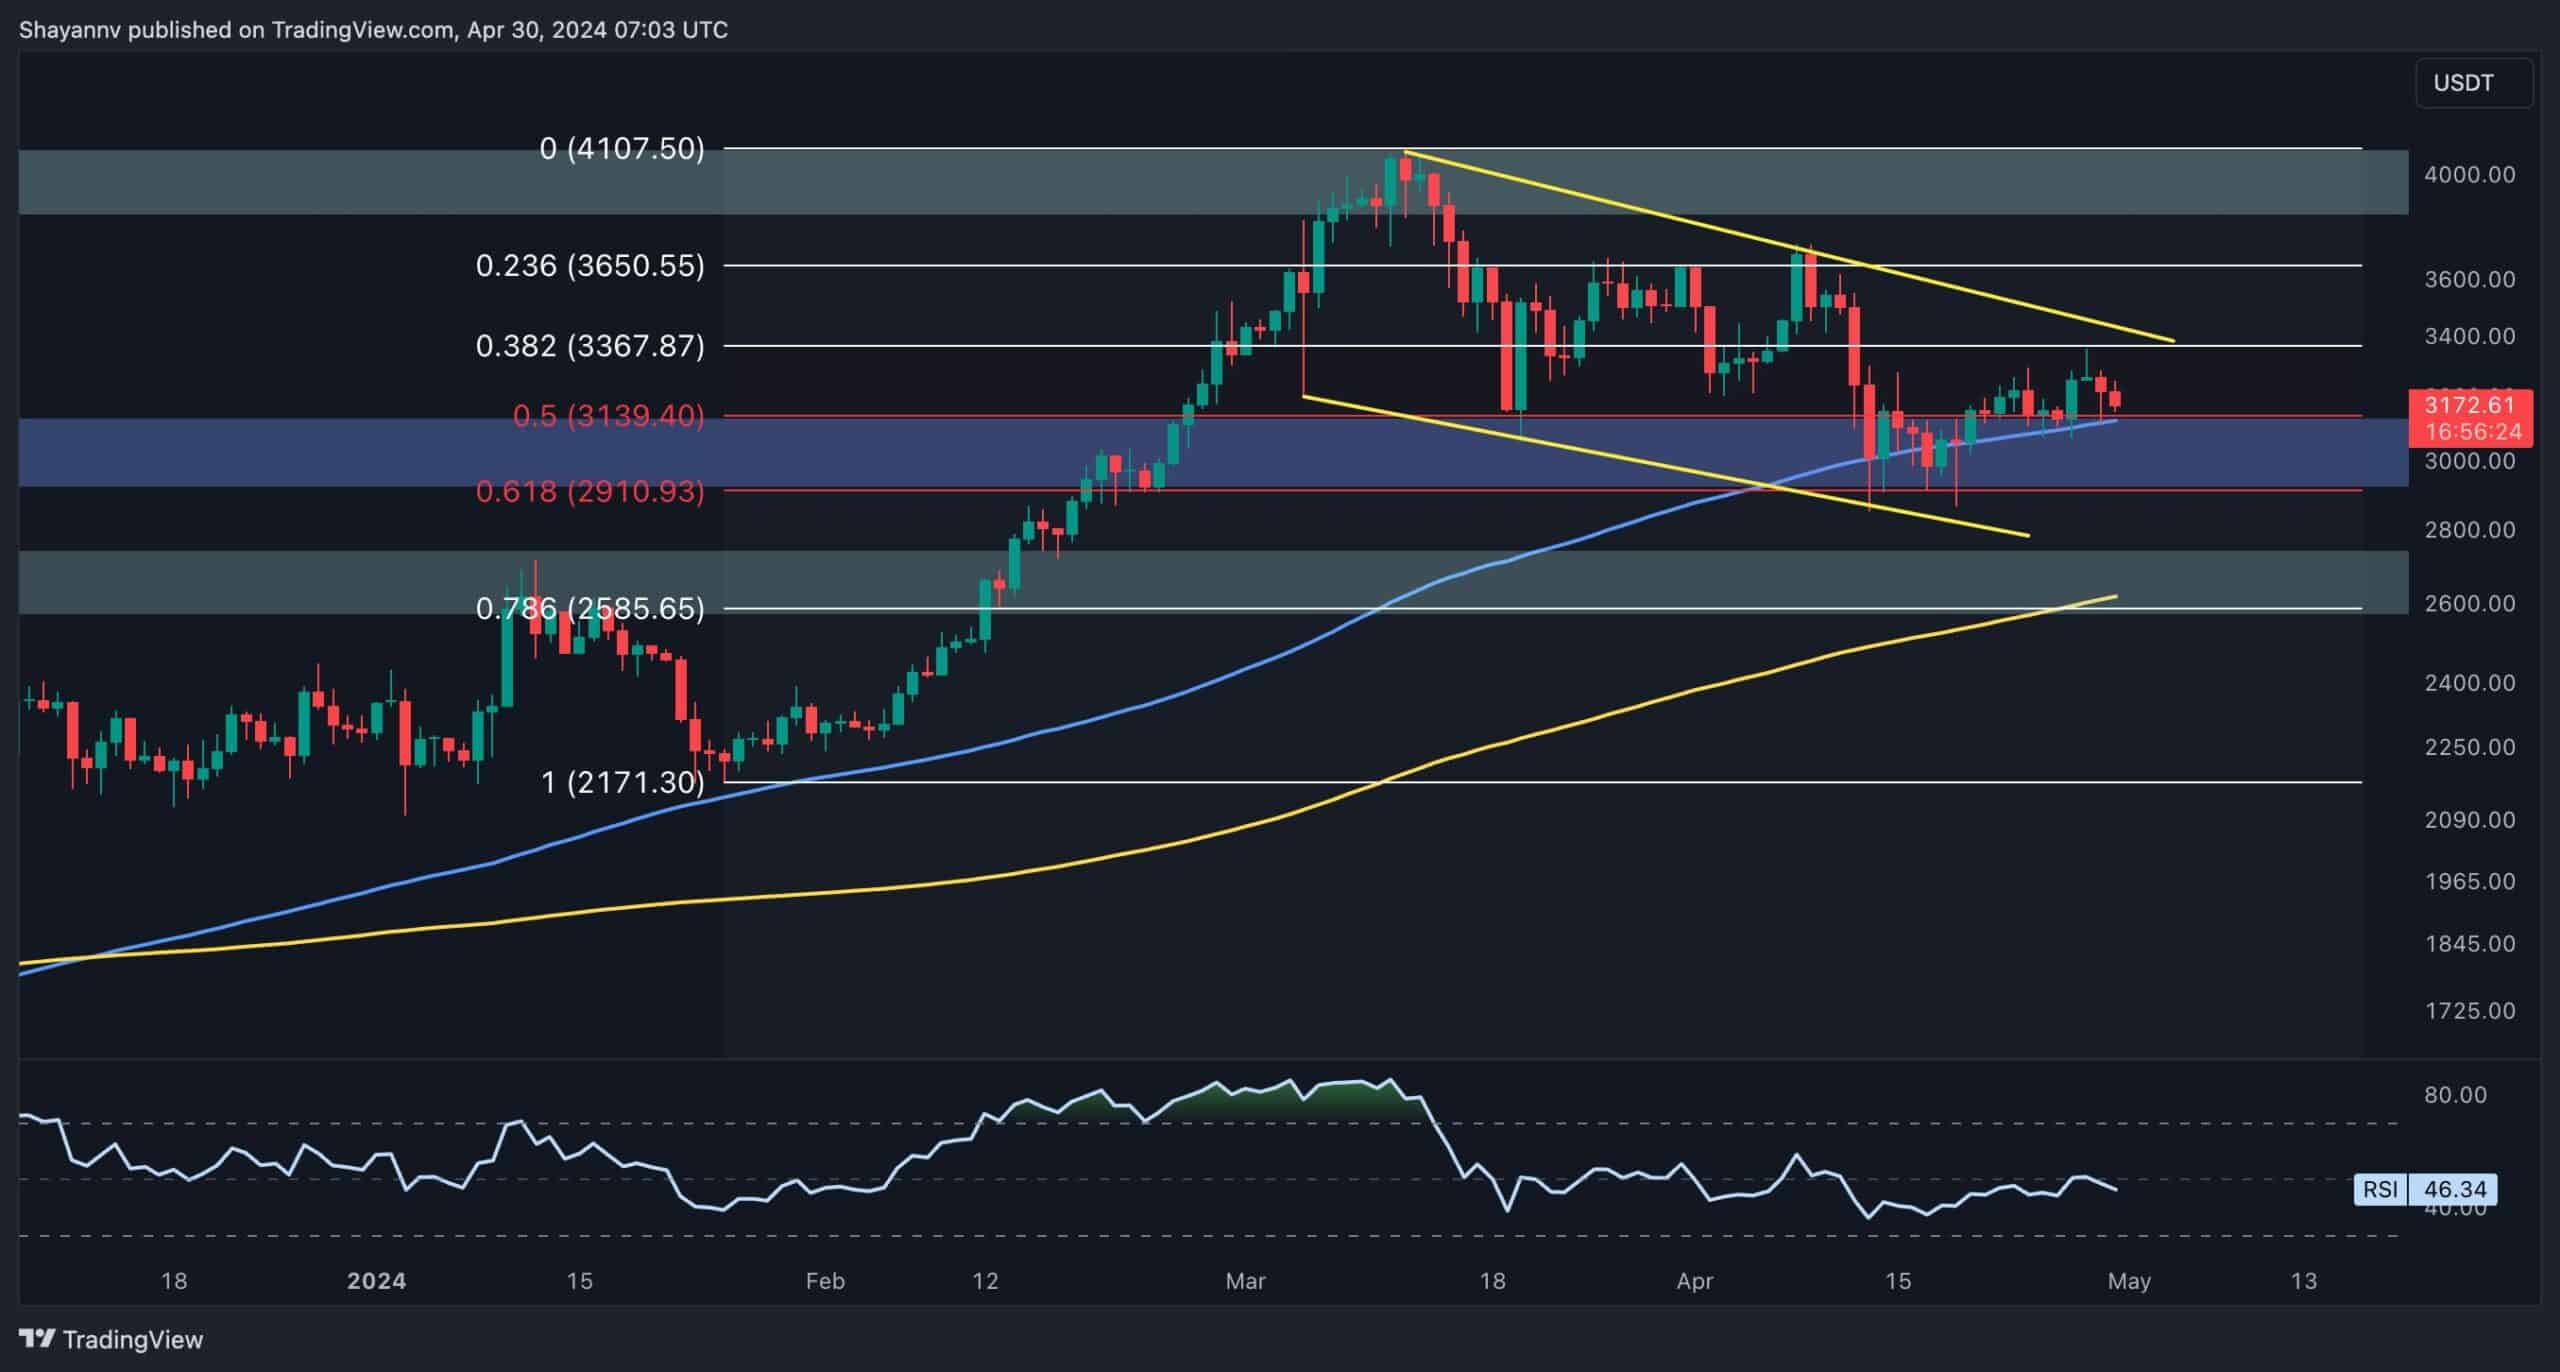
Upon examining the daily chart, it becomes apparent that Ethereum’s extended consolidation phase is near pivotal support levels.
These points, marked by the 0.5 ($3139) and 0.618 ($2910) Fibonacci retracement levels, along with the crucial 100-day MA, culminated in a slight bullish recovery. This consolidation also coincided with the lower boundary of the multi-month descending wedge pattern, typically signaling a bullish continuation.
However, Ethereum now faces a formidable resistance zone encompassing the wedge’s upper boundary and the critical $3.4K mark. A successful breach of this resistance could pave the way for a significant bullish surge towards the $4.1K threshold.
Conversely, failure to overcome selling pressure may result in the continuation of the consolidation phase within the upper boundary of the wedge pattern and the 100-day MA.

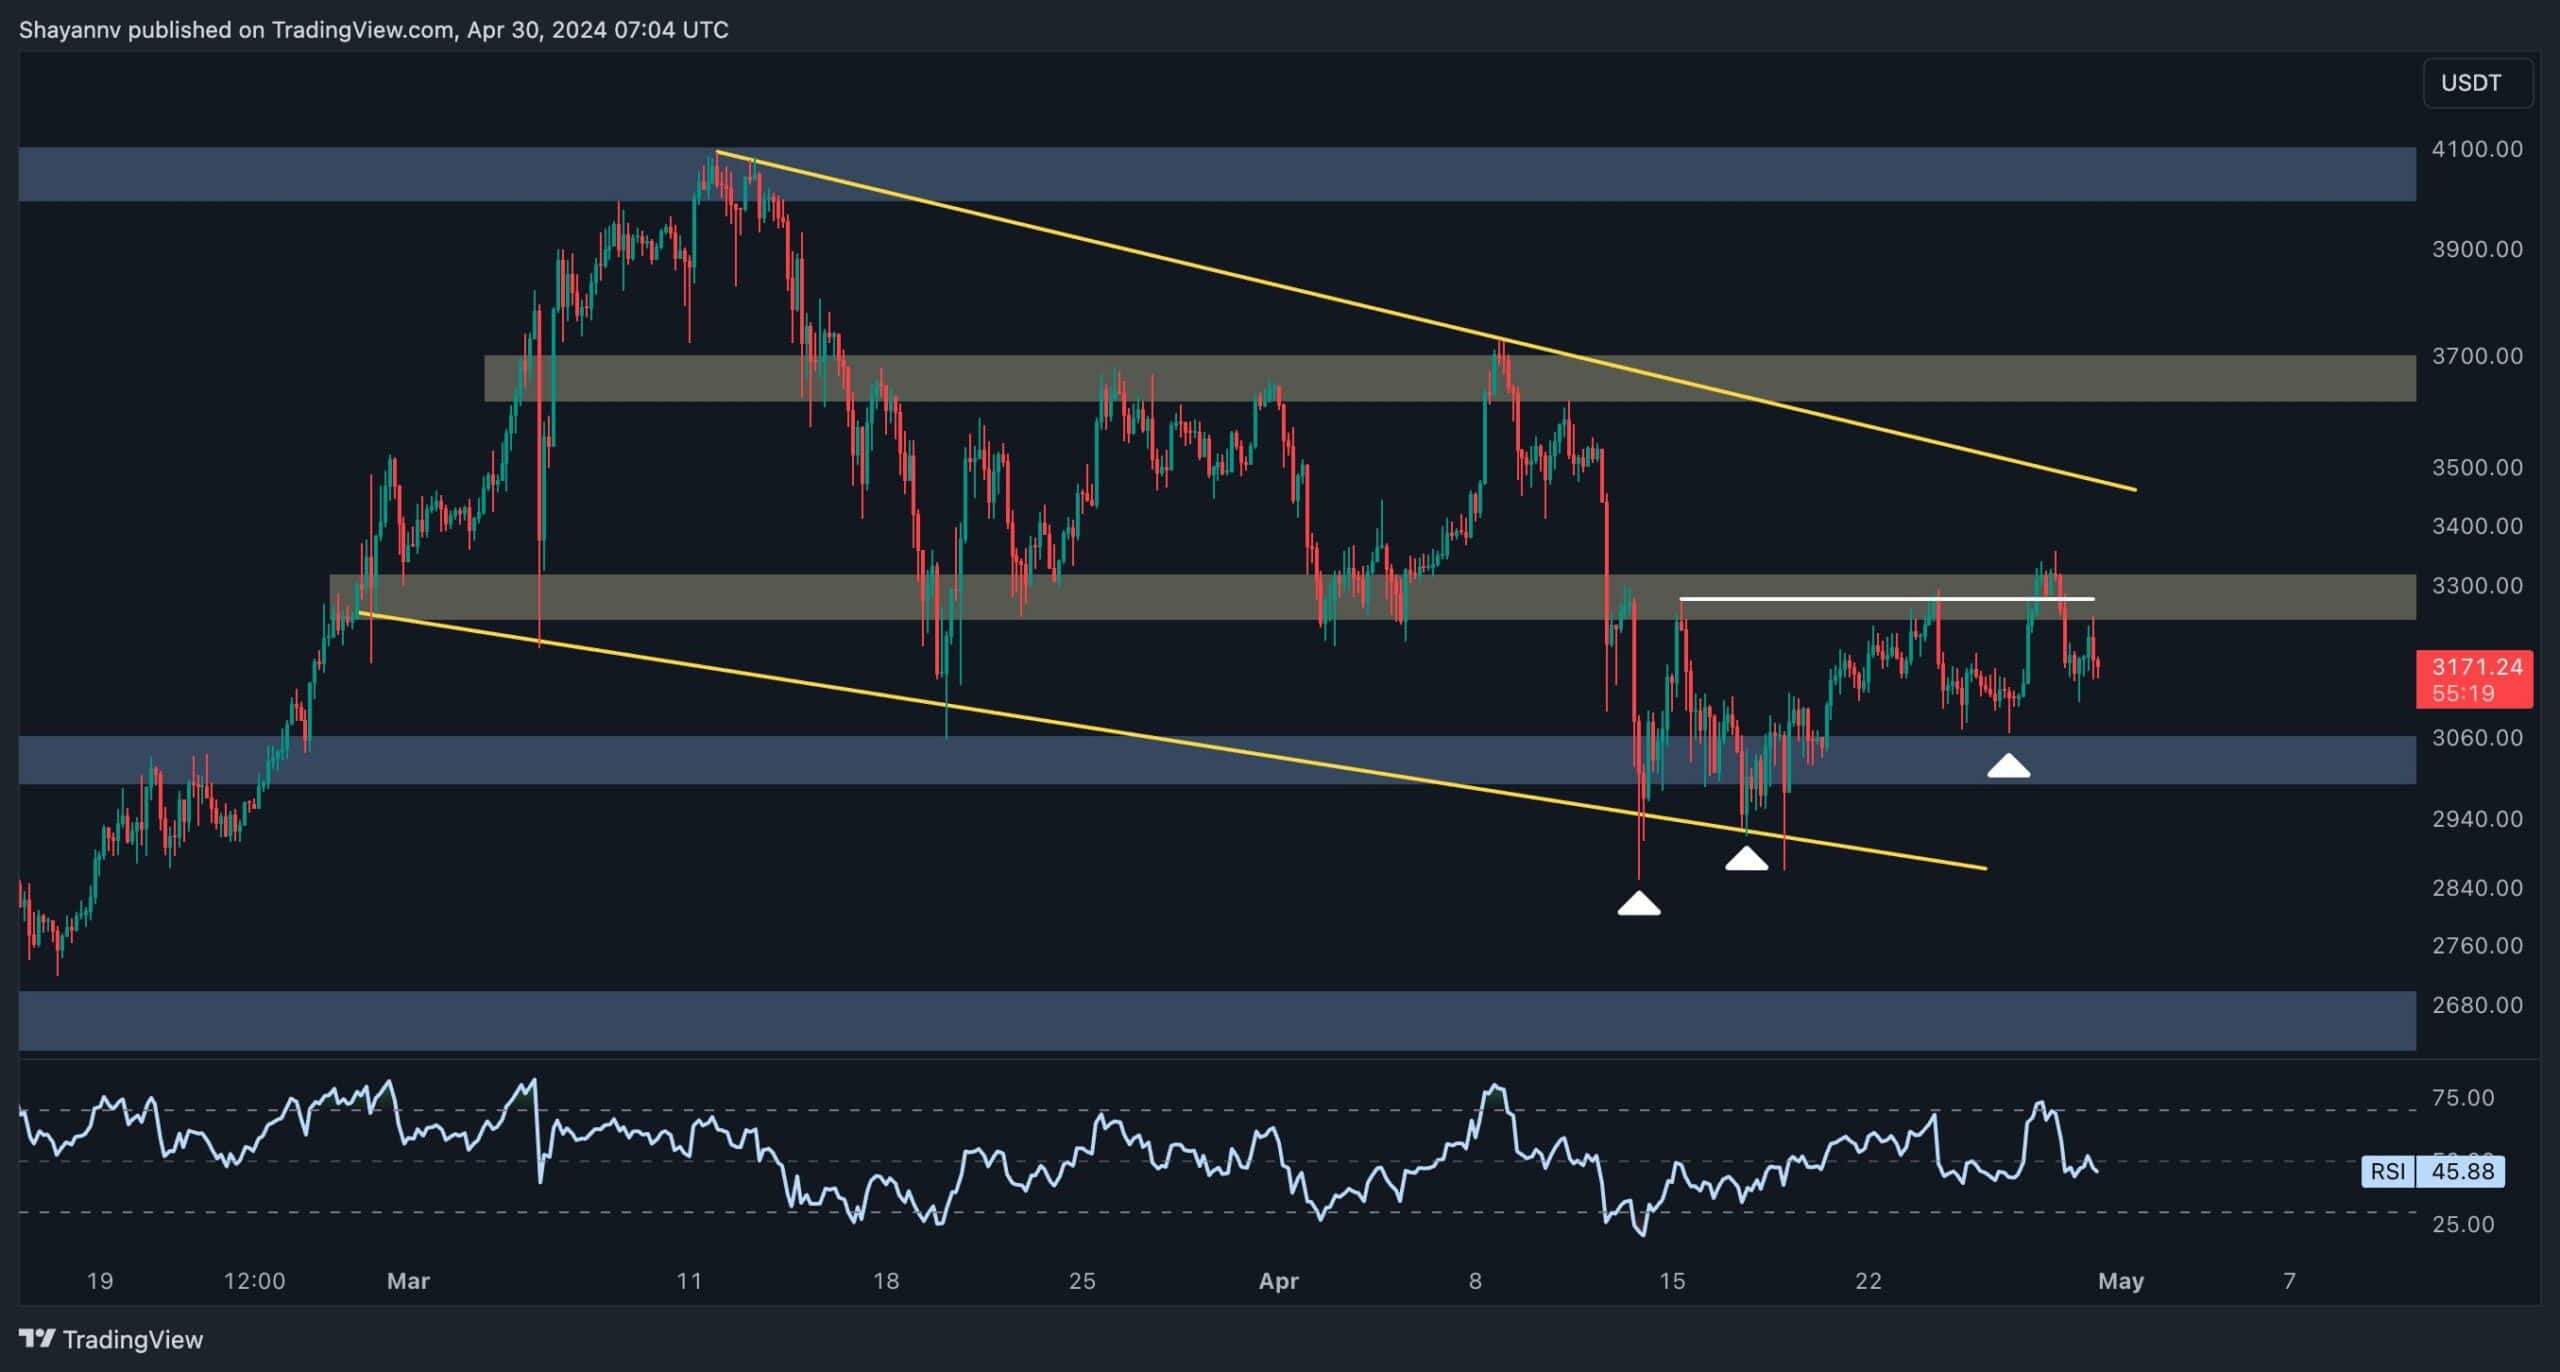
The 4-Hour Chart
Analyzing the 4-hour chart reveals Ethereum’s sideways movement near the lower boundary of the wedge pattern, corresponding to the $3K support region.
During this phase, Ethereum formed an inverted head and shoulders pattern, suggesting a potential bullish reversal. However, the price surged above the pattern’s neckline at $3.3K but was subsequently rejected, indicating a false breakout.
Given recent price action and prevailing market sentiment, Ethereum appears poised to continue its consolidation within the price range bounded by the $3.4K resistance region and the $3K support. A successful breach of this decisive range could herald a fresh price trend in the medium term.
Sentiment Analysis
By Shayan
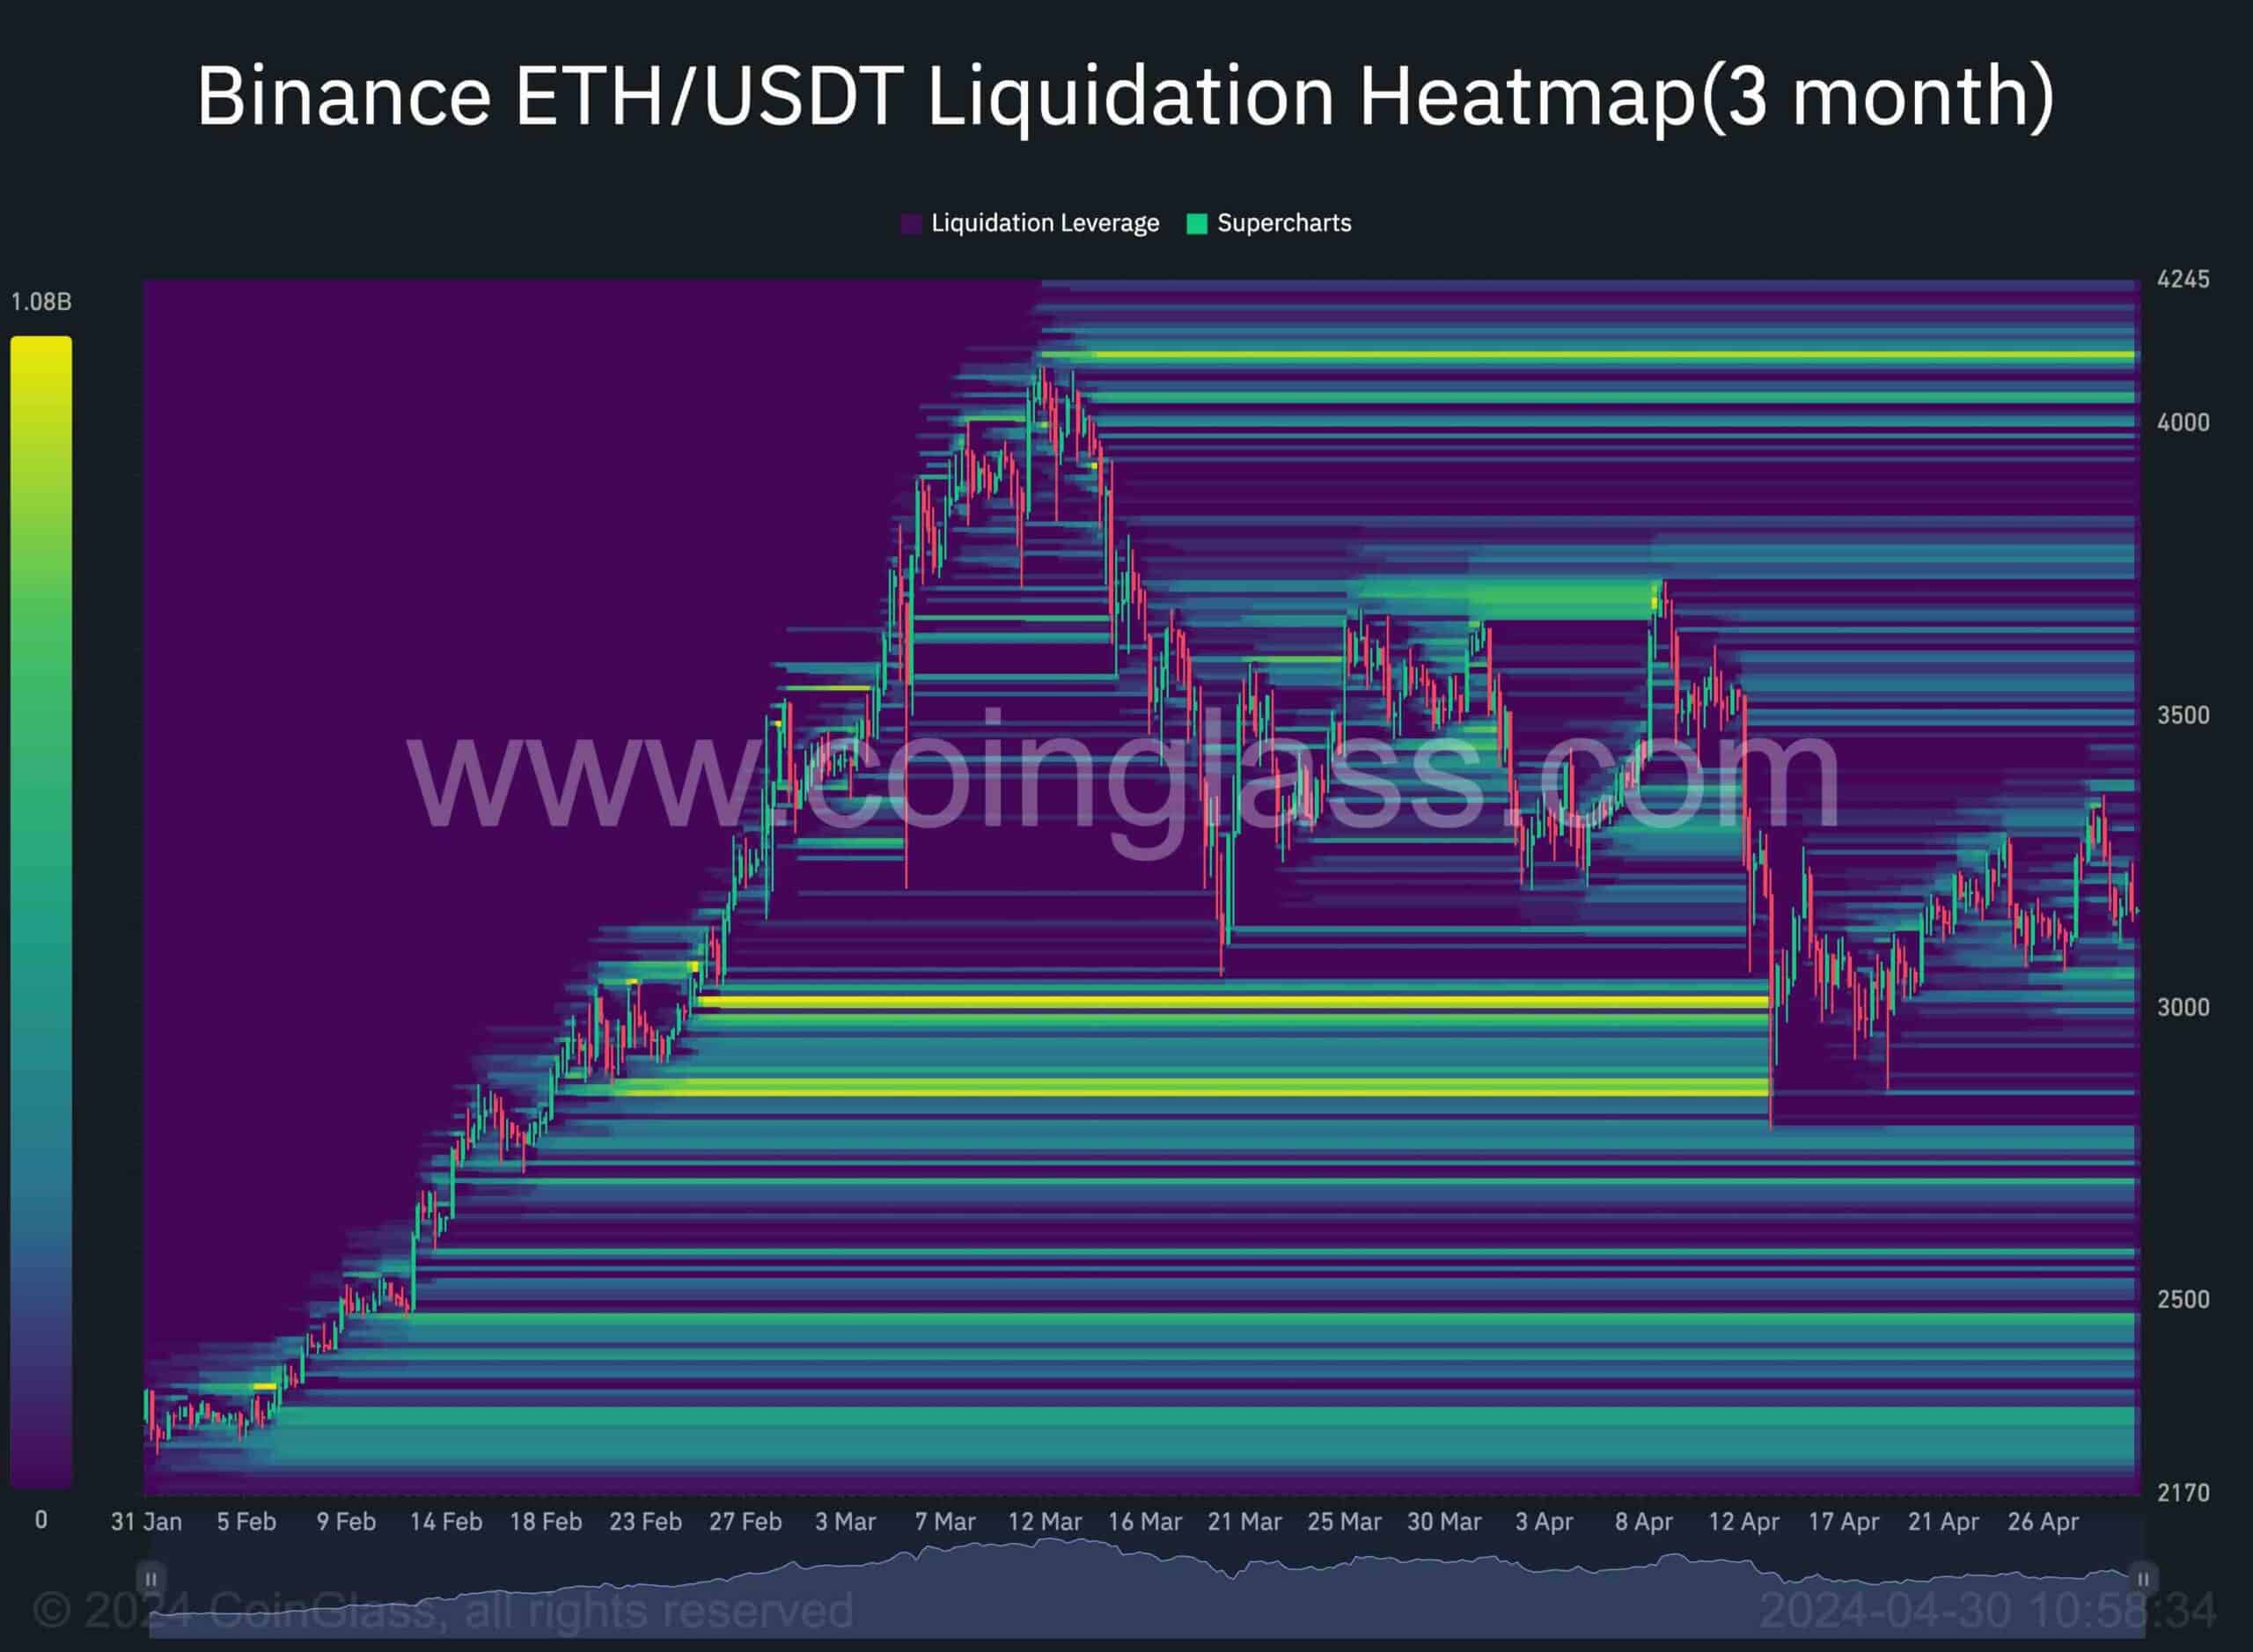
Following Ethereum’s recent rejection from the $3.3K swing high, investors may turn their attention to the behavior of traders in the futures market. The provided chart illustrates the liquidation heatmap for the Binance ETH/USDT pair, showcasing price levels with significant liquidity capable of influencing the price trend.
It’s evident that the pronounced drop below the critical $3K level resulted in the liquidation of a substantial number of long positions, triggering a cascade of sell-stop orders. However, since then, the price has been undergoing corrective retracements, leading to a cooling down of the futures market in recent weeks.
Consequently, there are currently no noteworthy levels of liquidity in Ethereum’s path in either direction in the short term. As a result, the market appears poised for a renewed impulsive movement driven by sentiment in the futures market.
Barring any unexpected developments in the short term and considering the heightened demand for Ethereum, the price may set its sights on liquidity above the $4K level in the long term.
The post Is ETH About to Plummet Below $3K or Will the Bulls Step In? (Ethereum Price Analysis) appeared first on CryptoPotato.